library(tidyverse)

fluxes_eos_read <- read_csv("compare_data/chamber_data.csv")

fluxes_eos <- fluxes_eos_read |>
    mutate(
        date = as.Date(`Julian Day`, origin = as.Date("2024-01-01")),
        seconds = (`Julian Day` - floor(`Julian Day`)) * 24 * 3600,
        time = hms::as_hms(seconds),
        datetime = as_datetime(paste(date, time))
    ) |>
    select(datetime, everything())

# View(fluxes_eos)Comparison with eosAC-T/O
fluxible_df <- readRDS("compare_data/fluxible_df.rds")

fluxes_eos_id <- fluxes_eos |>
  # filter(
  #   datetime > ymd_hms("2024-12-12 00:00:01")
  # ) |>
  arrange(datetime) |>
  rowid_to_column("id")

fluxible_df_id <- fluxible_df |>
  # filter(
  #   f_datetime > ymd_hms("2024-12-12 00:03:01")
  # ) |>
  arrange(f_datetime) |>
  rowid_to_column("id")

comparison_fluxes <- left_join(fluxible_df_id, fluxes_eos_id, by = "id") |>
  rename(
    eos_flux = `Flux CO2 (L) (umol/m^2/s)`,
    eos_slope = `f (Linear Slope)`
  )

comparison_fluxes2 <- full_join(fluxible_df, fluxes_eos, by = join_by("f_datetime" == "datetime")) |>
  rename(
    eos_flux = `Flux CO2 (L) (umol/m^2/s)`
  ) |>
  select(f_datetime, fluxible_flux, eos_flux) |>
  pivot_longer(!f_datetime, names_to = "method", values_to = "flux") |>
  drop_na(flux) |>
  arrange(f_datetime)

comparison_fluxes3 <- full_join(fluxible_df, fluxes_eos, by = join_by("f_datetime" == "datetime")) |>
  rename(
    eos_slope = `f (Linear Slope)`
  ) |>
  select(f_datetime, fluxible_slope, eos_slope) |>
  # pivot_longer(!f_datetime, names_to = "method", values_to = "slope") |>
  # drop_na(slope) |>
  arrange(f_datetime)

# View(comparison_fluxes3)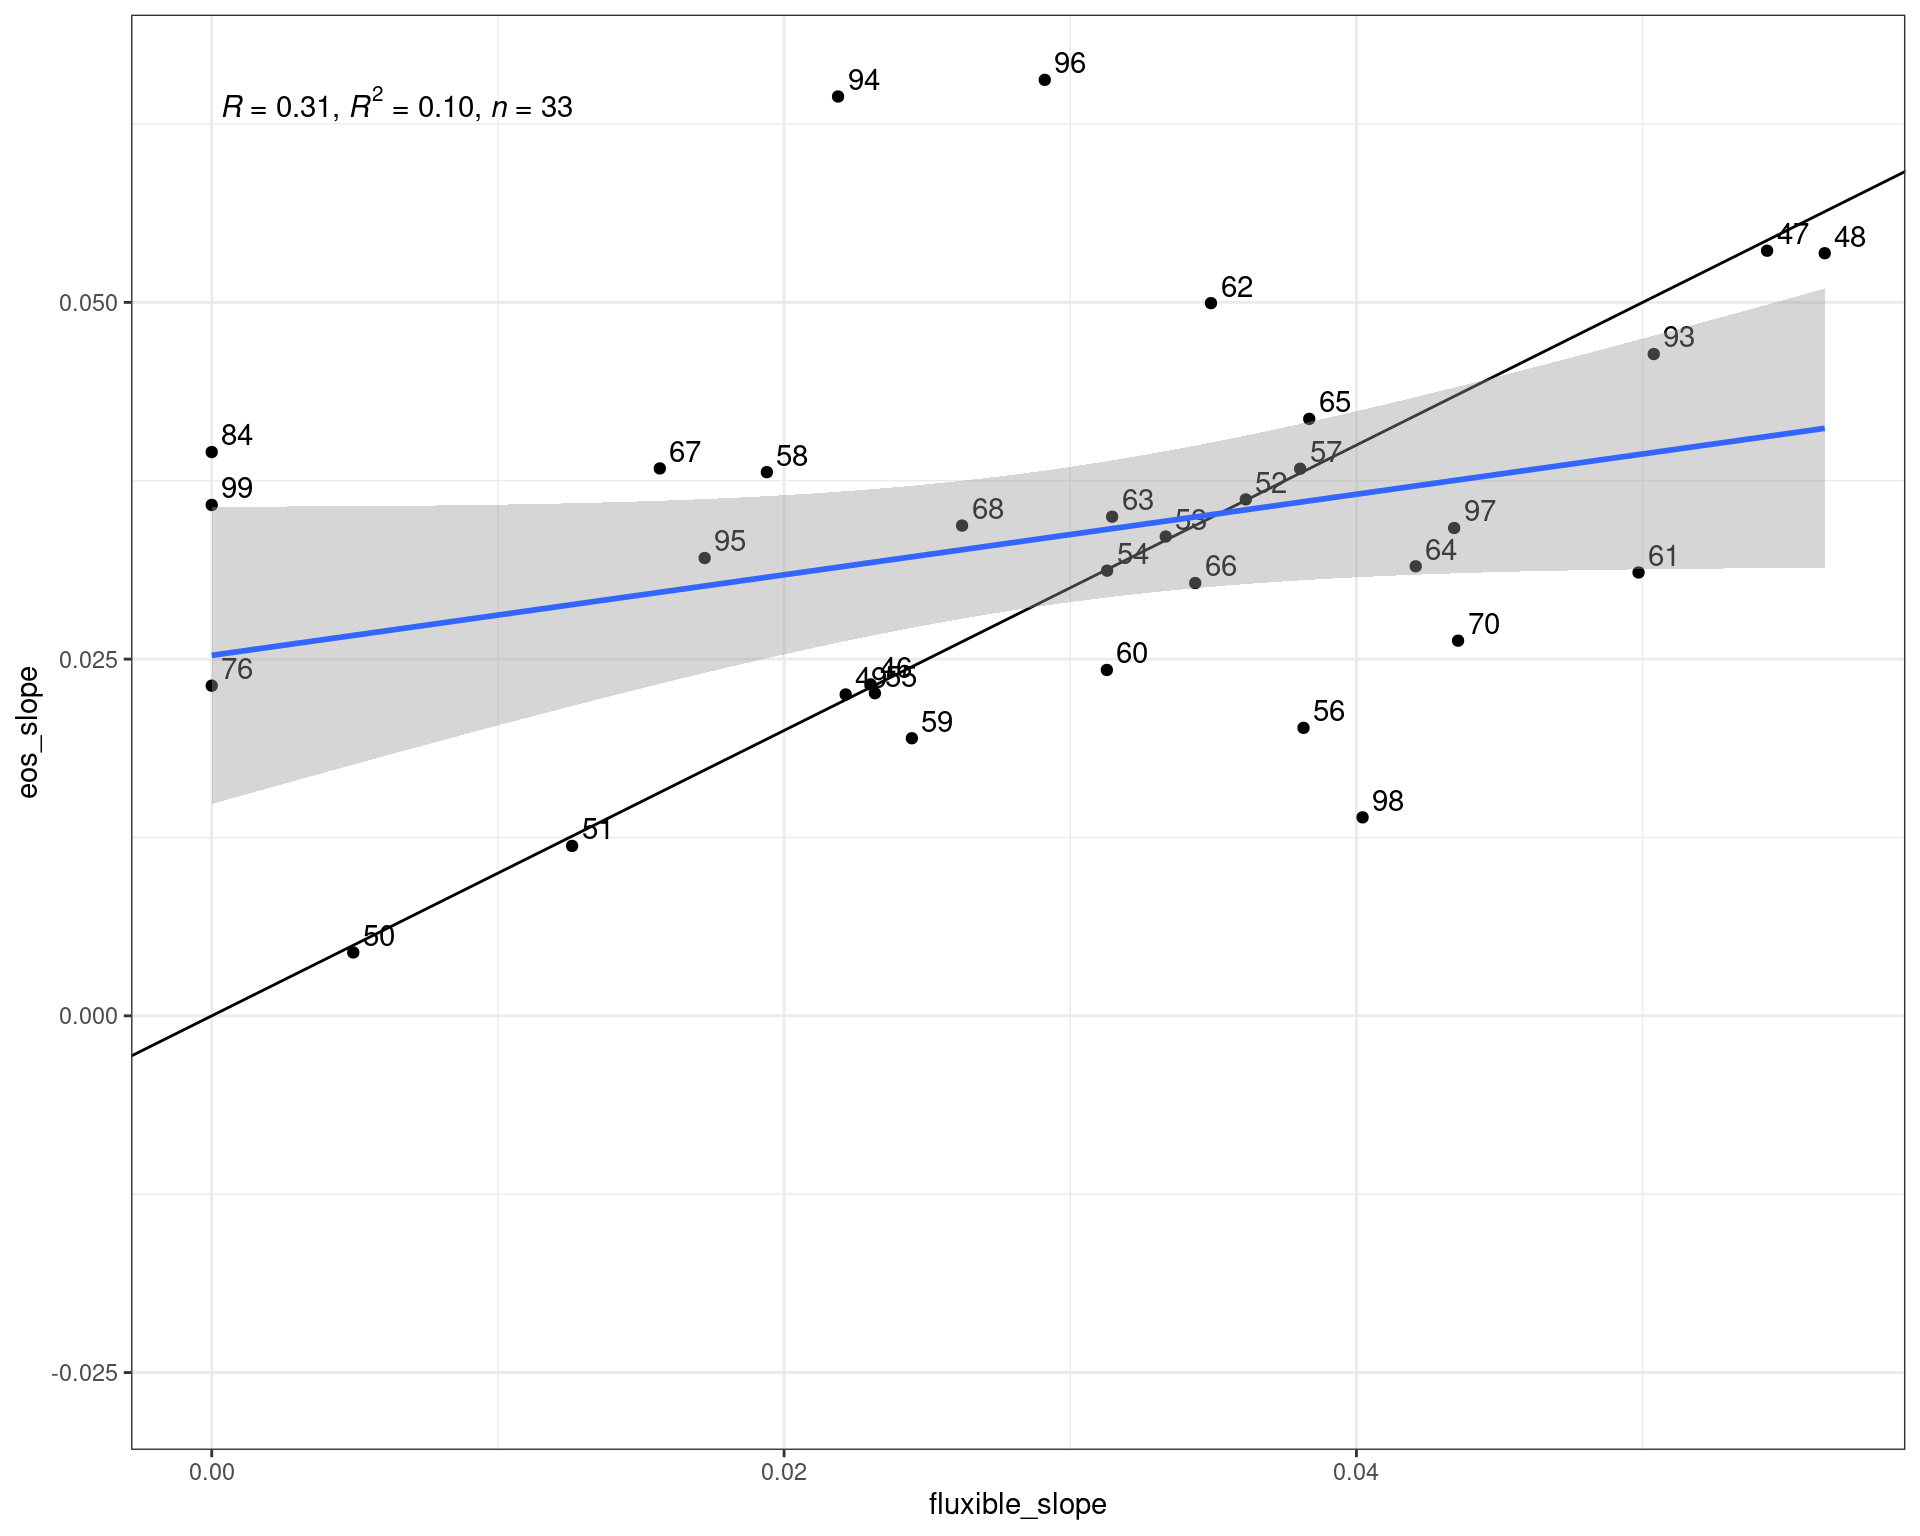
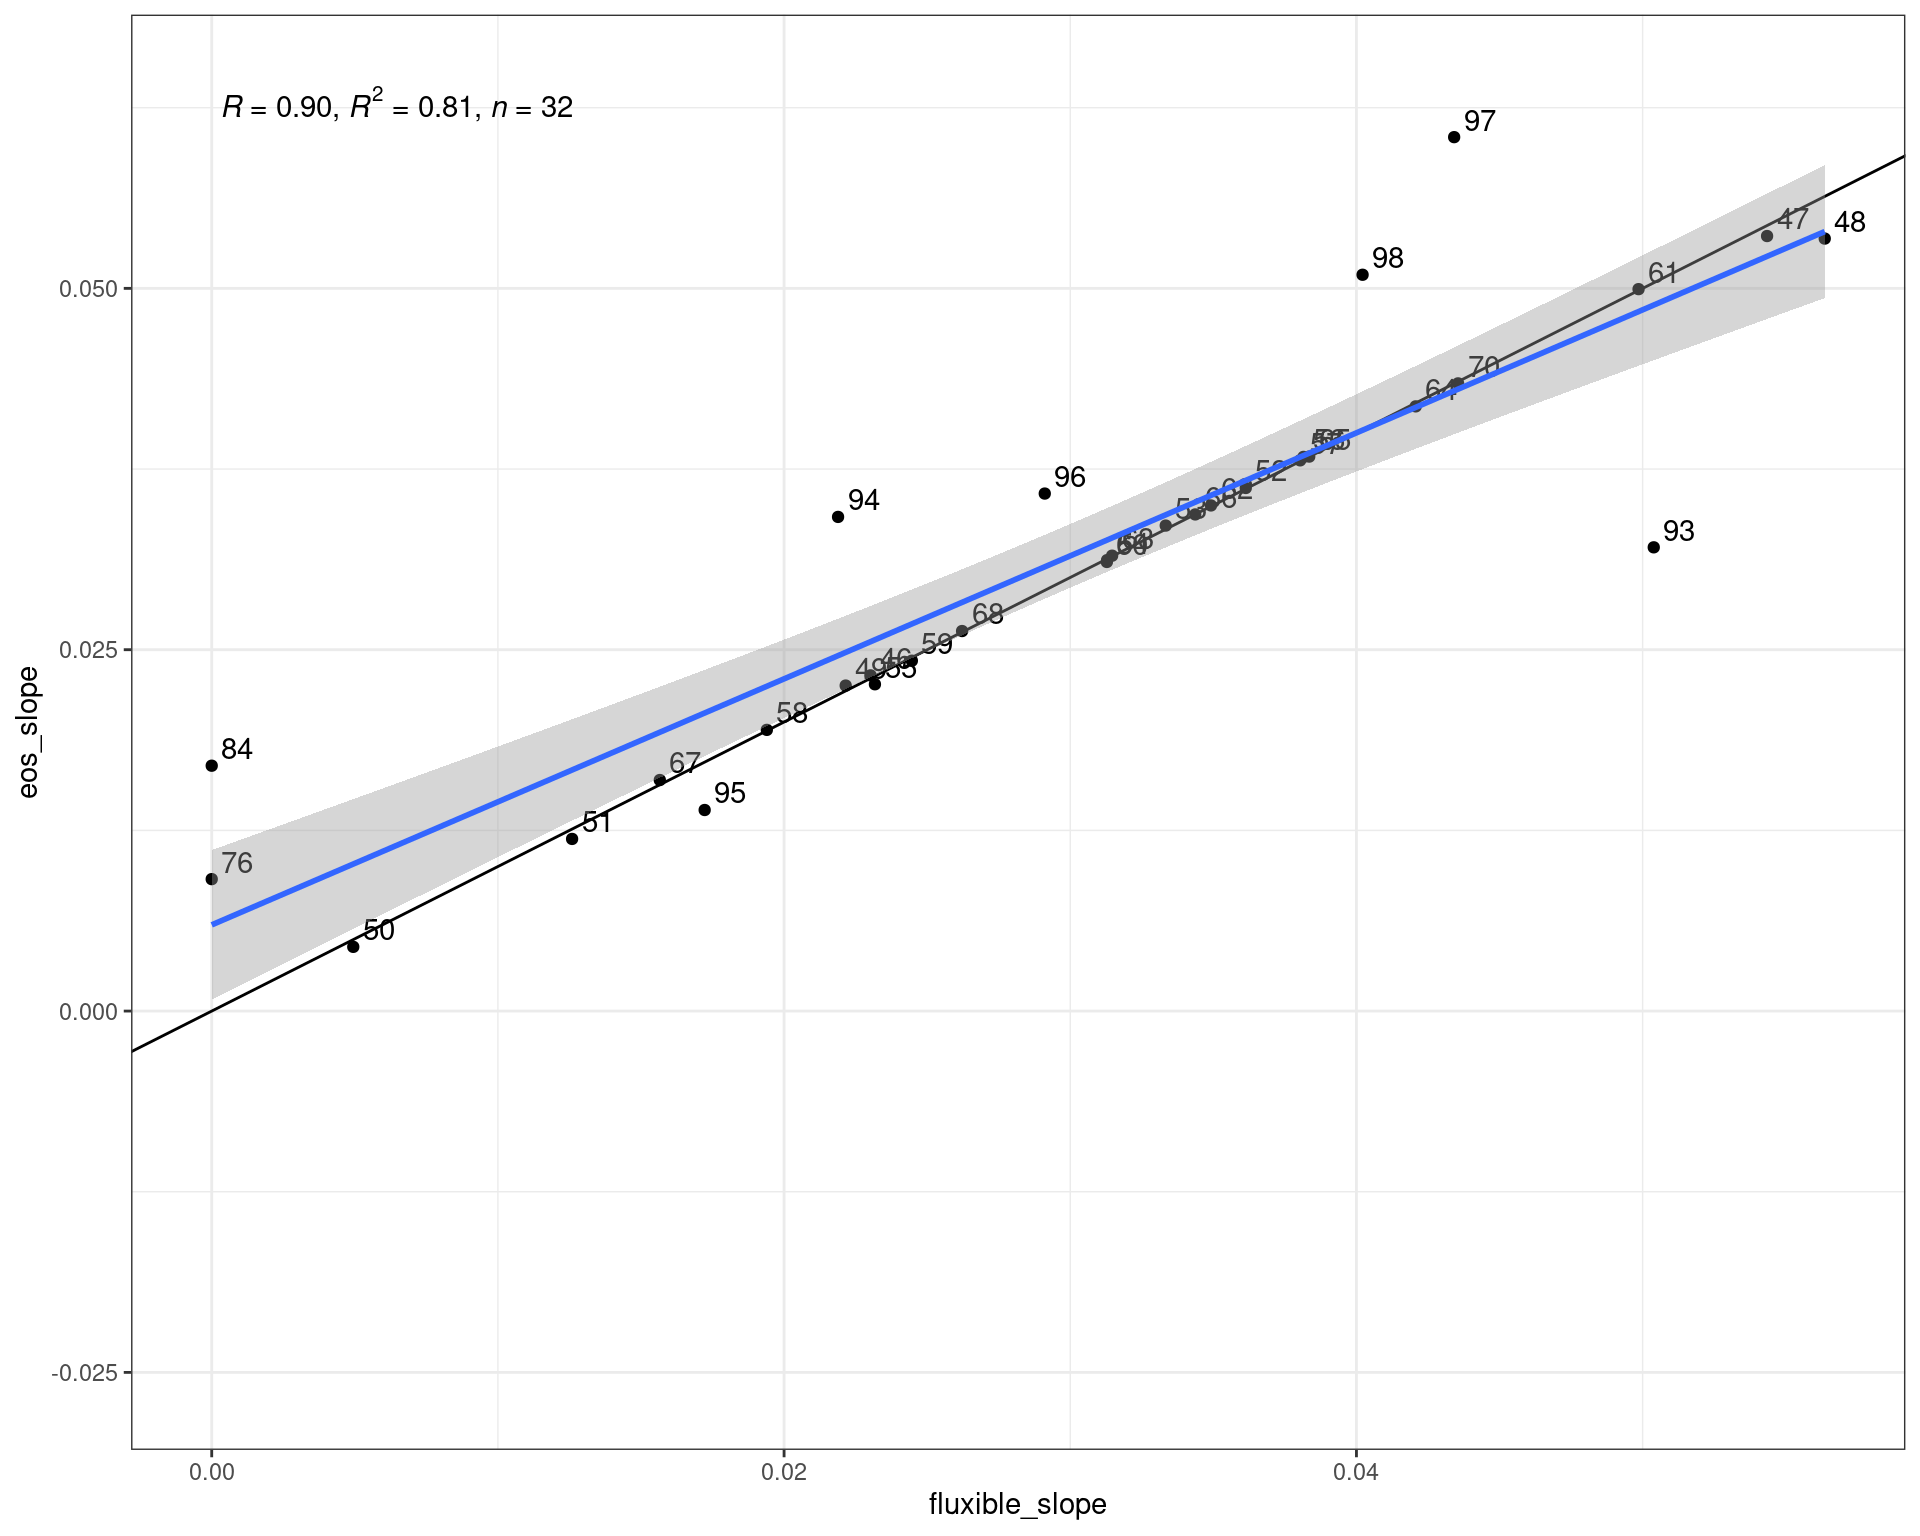
There are fluxes in the EOsense dataset that were not produced by fluxible. We identify them and remove them before pairing.
fluxible_df <- readRDS("compare_data/fluxible_df.rds")

fluxes_eos_id <- fluxes_eos |>
  arrange(datetime) |>
  rowid_to_column("eos_id") |>
  filter(
    !(eos_id %in% c(12, 22, 52)) # those are "in between" fluxes in the fluxible dataset
  ) |>
  rowid_to_column("id")

fluxible_df_id <- fluxible_df |>
  arrange(f_datetime) |>
  rowid_to_column("id")

comparison_fluxes4 <- left_join(fluxible_df_id, fluxes_eos_id, by = "id") |>
  rename(
    eos_flux = `Flux CO2 (L) (umol/m^2/s)`,
    eos_slope = `f (Linear Slope)`
  )

# View(comparison_fluxes4)